13. 統計簡介 (Introduction to Statistics)
13.1 統計圖
統計圖的種類有很多。要選取哪種統計圖去表達所搜集得來的數據,取決於數據的性質與多寡,調查的目的和要強調的重點等。
喺初中,大家基本上學識以下咁多種統計圖都應該已經足夠。
13.1.1 圓形圖 / Pie chart
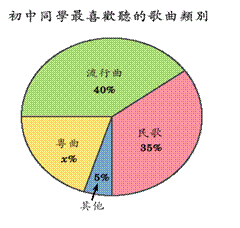
特點/用途:
- 表示各項目佔全部的百分數
- 不能表示數據的走勢變化
13.1.2 折線圖 / Broken-line graph
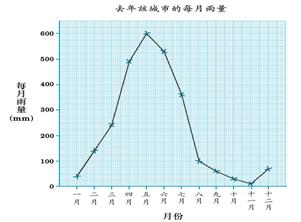
特點/用途:
- 表示數據在某段時間(x軸) 內某項目的頻數(y軸)的變化及趨勢
13.1.3 組織圖 (直方圖) / Histogram
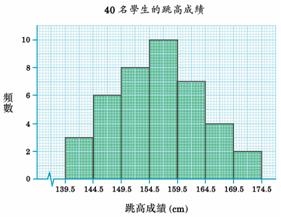
特點/用途:
- 表達已分組的連續數的頻數分佈
- 容易比較各組數據出現的多寡
13.1.4 幹葉圖 / Stem-and-leaf diagram
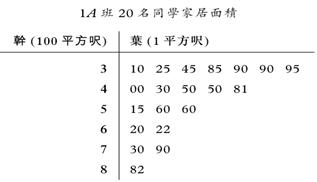
特點/用途:
- 將數據圖像化地表達而又能保留數據的每個數值
13.1.5 散點圖 / Scatter diagram
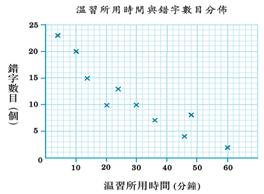
特點/用途:
- 表達兩個項目的關係
中一數學【目錄】
- 1. 有向數 (Directed Numbers)
- 2. 代數式和方程式 (Algebraic Expressions & Equations)
- 3. 指數及進制 (Laws of integral indices)
- 4. 多項式 (Polynomials)
- 5. 百分法 (Using percentages)
- 6. 近似值與估算 (Approximate values & estimation)
- 7. 幾何簡介 (Introduction to Geometry)
- 8. 對稱及變換 (Symmetry and Transformation)
- 9. 全等及相似 (Congruence and Similarity)
- 10. 量度方面的估計 (Estimation in measurements)
- 11. 面積及體積 (Area and Volume)
- 12. 坐標簡介 (Introduction to Coordinates)
- 13. 統計簡介 (Introduction to Statistics)
- *** 初中試卷 / 試題庫 ***
