德望學校 – S1數學 1B Chapter 14 Simple Statistical Diagrams and Graphs (I) – CQ (11-16)
Good Hope School – S1 Maths Exam Question (by-topic)
1B Chapter 14 Simple Statistical Diagrams and Graphs (I) – CQ (11-16)
德望學校 數學 中一考試 歷屆試題 (by-topic)
Simple Statistical Diagrams and Graphs (I) Conventional Questions (11-16)
數學試卷 只供溫習、操卷之用。
試卷答案:
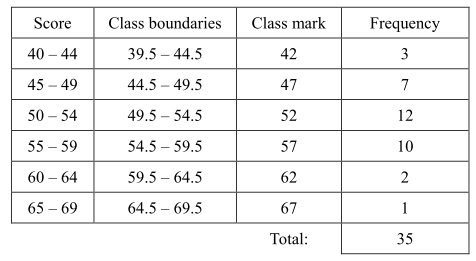
- a)
b)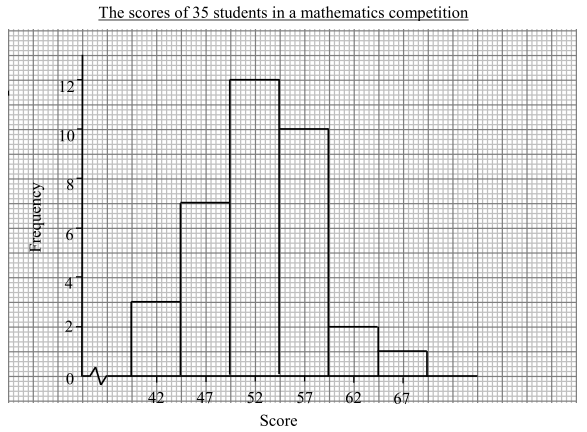
c) x = 4 (or 3)
y = 5 (or any value from 5 to 9) - a)
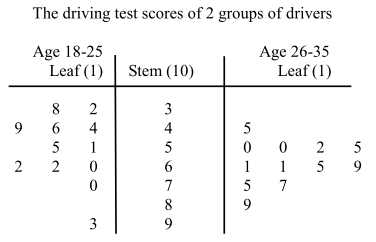
b) The group of drivers with age 26-35 obtains a higher overall score because more drivers (11 out of 12) get 50 marks or above.
c) \(20\dfrac{5}{6}%\) - a)
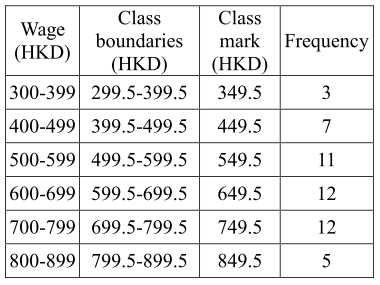
b)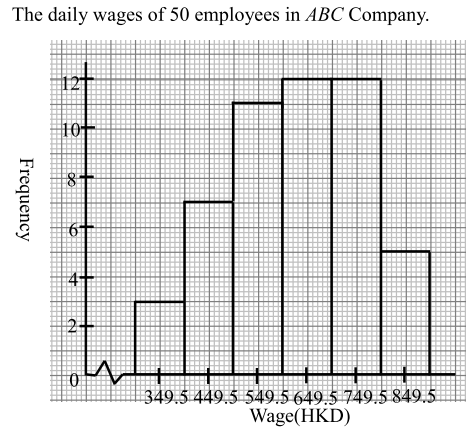
- a i)
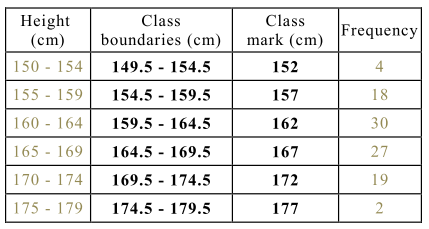
ii) 5 cm
iii) 179.45 ≤ any value < 179.5
b) Her height increases from 12 years old to 16 years old, and then remains unchanged from 16 years old to 18 years old. - a) 36°
b) 70% - a) x = 3 and y = 5
b i)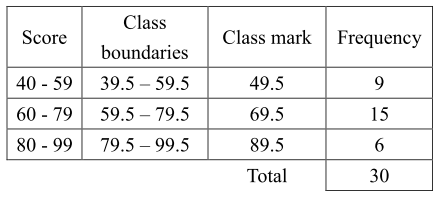
ii) 72°
中一數學【目錄】
- 1. 有向數 (Directed Numbers)
- 2. 代數式和方程式 (Algebraic Expressions & Equations)
- 3. 指數及進制 (Laws of integral indices)
- 4. 多項式 (Polynomials)
- 5. 百分法 (Using percentages)
- 6. 近似值與估算 (Approximate values & estimation)
- 7. 幾何簡介 (Introduction to Geometry)
- 8. 對稱及變換 (Symmetry and Transformation)
- 9. 全等及相似 (Congruence and Similarity)
- 10. 量度方面的估計 (Estimation in measurements)
- 11. 面積及體積 (Area and Volume)
- 12. 坐標簡介 (Introduction to Coordinates)
- 13. 統計簡介 (Introduction to Statistics)
- *** 初中試卷 / 試題庫 ***
